Difference between revisions of "Viewing Data"
(→Filters) |
(→Percentages) |
||
| Line 260: | Line 260: | ||
== Percentages == | == Percentages == | ||
| + | * It can be helpful to look at the data from the report using Percentages. The example below is using Percentages to get the percentage of student cohorts for each proficiency level (1-4). | ||
| + | |||
| + | |||
| + | * Click on Percentages at the top. | ||
[[File:VCAT2_Percentages.png]] | [[File:VCAT2_Percentages.png]] | ||
[[File:VCAT2_Percentages_1to1-2to2.png]] | [[File:VCAT2_Percentages_1to1-2to2.png]] | ||
| + | [[File:Wiki_ViewData_Reports_Percentages_HorizontalSeries.png]] | ||
| + | |||
| + | [[File:Wiki_VCAT2_3D_bar_graph.png|500px]] | ||
== Scales == | == Scales == | ||
Revision as of 21:11, 9 December 2016
Contents
- 1 Options to View Data
- 2 Options to Refine Reports
- 3 Options to Export Reports
Options to View Data
To View Data, you need to have selected the Students, and selected the Information you are interested in viewing for those students.
There are many options to view data in VCAT. Data can be viewed not only where you enter the data, but also using the following reports:
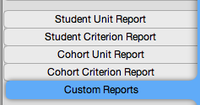
• Student Unit Report
• Student Criterion Report
• Cohort Unit Report
• Cohort Criterion Report
• Custom Reports
Student Unit Report
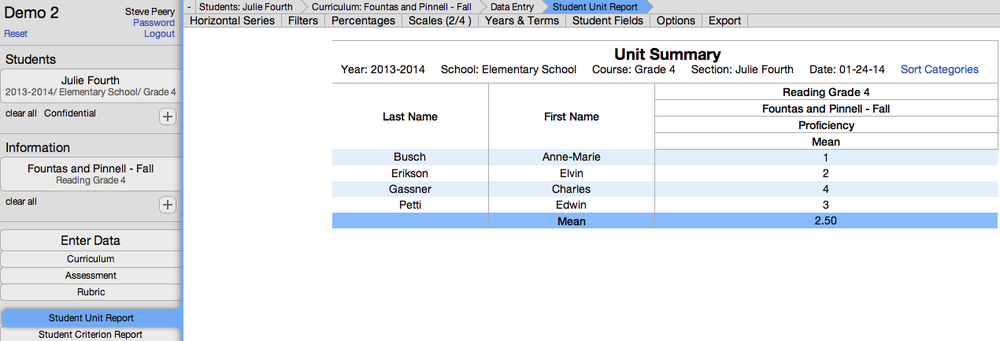
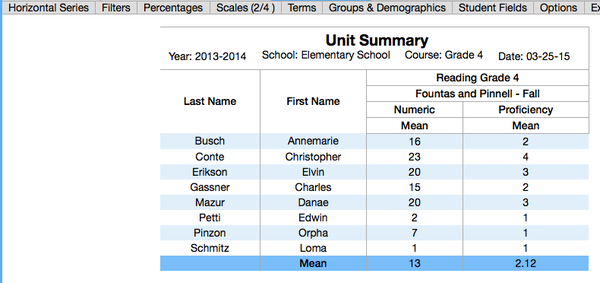
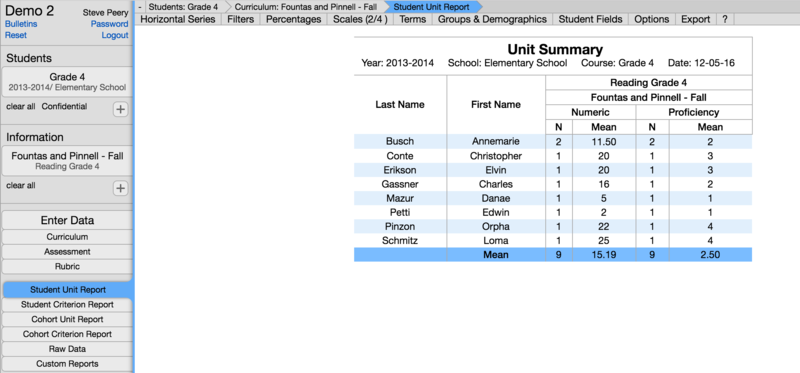
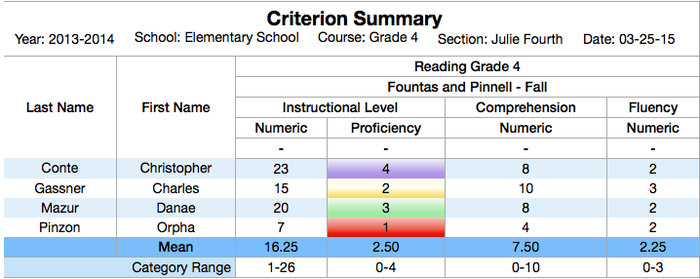
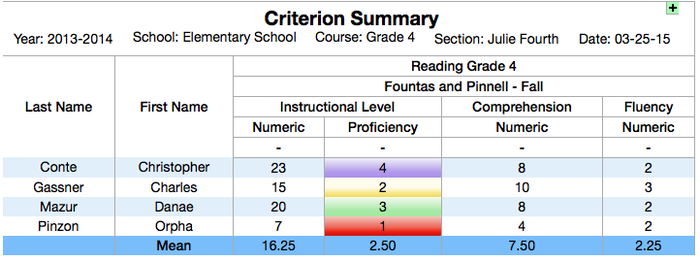
In this sample, one group of students is selected with one piece of information. Students are listed in alphabetical order using their last name. This Student Unit Report displays one student per row with one summarized value for the unit. The summarized value is dependent on the weight assigned to the criteria in the unit. If one criterion has all of the weight (100%), then that score will be used as the summary value to give a quick snapshot for that unit. If more criteria share the weight equally distributed (by default), the summarized value will be an average of the weighted criteria. Occasionally, none of the criteria are weighted. When that is the case, no summarized value can be calculated therefore, the Student Unit Report can't be generated. The bottom row highlighted in blue gives you the Mean (average) scores for the group of students you have selected. Many options are available to refine this report.
Student Criterion Report
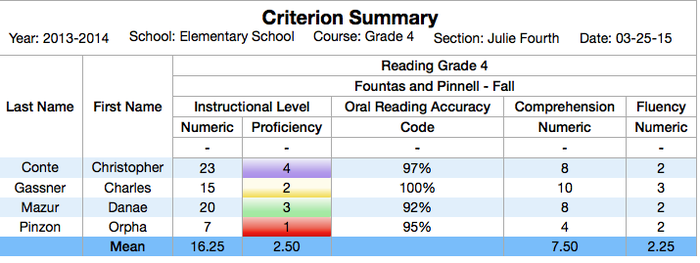
In this sample, one group of students is selected with one piece of information. Students are listed in alphabetical order using their last name. This Student Unit Report displays one student per row with the detailed scores for each of the criteria in the unit in individual columns. The bottom row highlighted in blue gives you the Mean (average) scores for the group of students you have selected. Many options are available to refine this report.
Criterion Detail Report
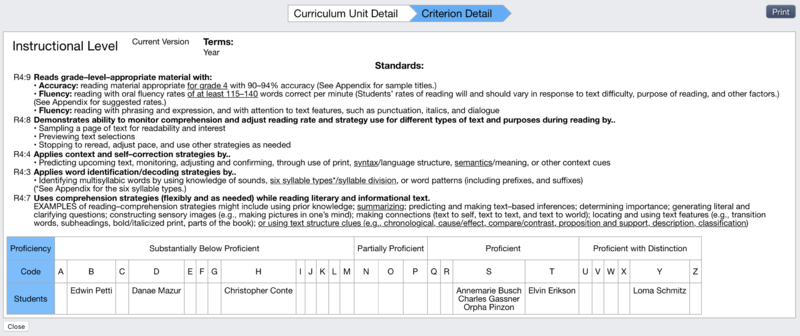
1.When running a criterion report (student criterion report or cohort criterion report), hover over the criterion name (column header) with your mouse to see the little blue i appear on the left.
2.Click on the i to create the Criterion Detail report. If you wish to print this report, click on the print button at the top right corner.
Cohort Unit Report
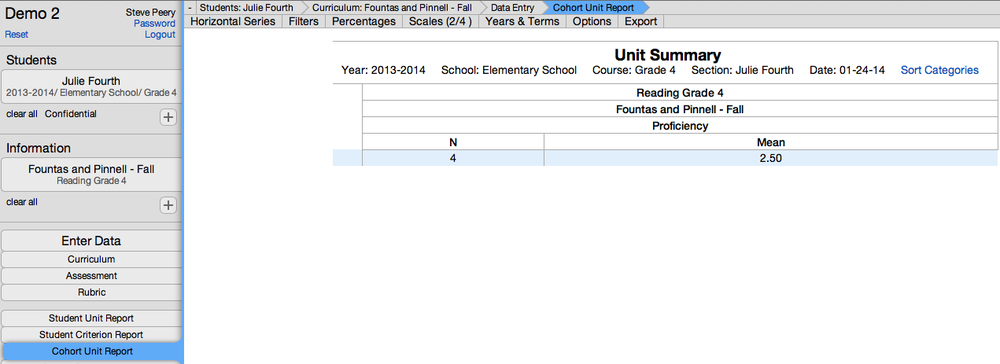
In this sample, one group of students is selected with one piece of information. This report displays one cohort per row with the mean of the summarized values for the cohort. The 'N' of 4 indicates that there are 4 students with data included in the Mean. Many options are available to refine this report.
Cohort Criterion Report
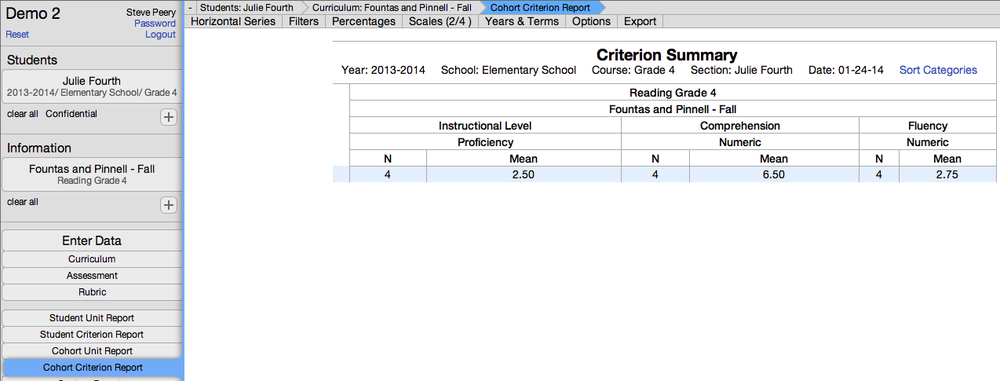
In this sample, one group of students (cohort) is selected with one piece of information. This report displays one cohort per row with the mean score for each of the criteria with numeric scores in the unit. The 'N' indicates the number of students with data included in each of the criterion mean. Many options are available to refine this report.
Criterion Detail Report
1.When running a criterion report (student criterion report or cohort criterion report), hover over the criterion name (column header) with your mouse to see the little blue i appear on the left.
2.Click on the i to create the Criterion Detail report. If you wish to print this report, click on the print button at the top right corner.
Custom Reports
Custom Reports are reports specifically created and customized for your SU/district, and ready to download/print. Report Cards, Progress Reports, Placement Forms, and Student Accommodation Plan would be some examples of custom reports.
How to run a custom report for a group of students
1. Select the students.
2. Click on Custom Reports to get the list of custom reports available to you.
3. Select the custom report of your choice. The list can be filtered by Type, Grade, and/or Subject to narrow down the selection. Use the Clear button to the right of the Subject filter to cancel all filters.
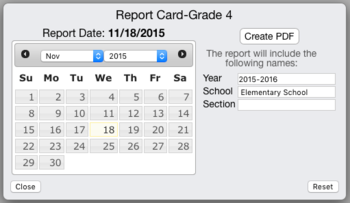
4. After you have selected a report, you will be prompted with a calendar to select the date you wish to run the report for. Often times in custom reports, some values come straight from the student selection, like Year, School, Course, and Section. If the current student selection does not include any of these elements part of the report, the fields will be shown blank. Type in the information you wish to show on the report for those fields. Click on Create PDF to run the report.
How to run a custom report for Individual Student(s)
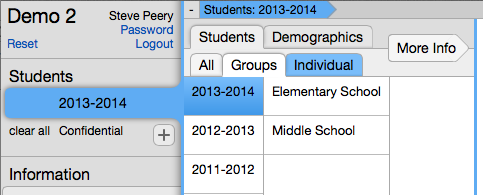
1. By default, you are under Groups tab where you can select the Year, School, Course, and Section. Click on Individual tab, to the right of the Groups tab.
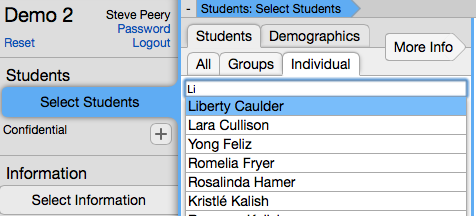
2. Type first name OR last name (or part of either one) in the Search field. Click on the student name from the list displayed to select that student.
3. Now, the student's name shows up in the Students box and also on the right, with a little minus sign in a red circle. If you wish to remove that student, click on the red circle.
4. Repeat step 2 for each individual student you want to add.
The individual students selected show in one student box therefore, they are considered as one cohort.
5. Click on Custom Reports to get the list of custom reports available to you.
6. Select the custom report of your choice. The list can be filtered by Type, Grade, and/or Subject to narrow down the selection. Use the Clear button to the right of the Subject filter to cancel all filters.
7. After you have selected a report, you will be prompted with a calendar to select the date you wish to run the report for. Often times in custom reports, some values come straight from the student selection, like Year, School, Course, and Section. If your current student selection does not include any of these elements part of the report, the fields will be shown blank. Type in the information you wish to show on the report for those fields. Click on Create PDF to run the report.
Active / Inactive Custom Reports
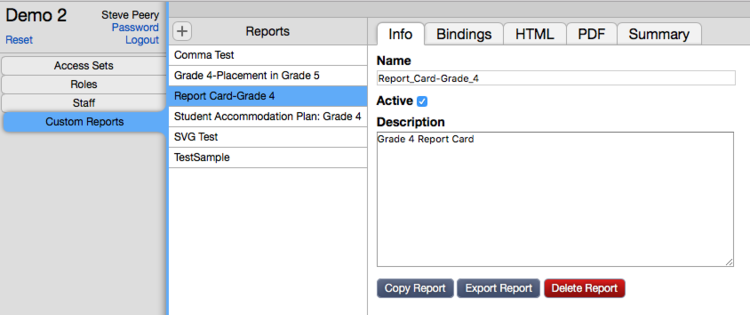
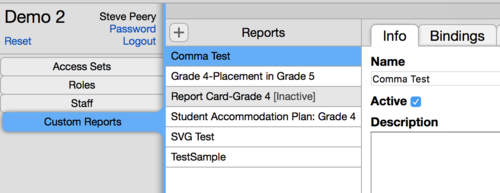
Under the A tab, go to the Custom Reports section. Select the custom report. Under Info, there is an Active checkbox.
If you uncheck the Active box for the custom report selected, that report will become inactive. Every inactive custom reports will be marked with [Inactive] and shaded gray.
Under the Data tab, the Custom Reports list has an Active Only checkbox in the filter bar, at the top. By default, the Active Only box is checked and the list will only display the custom reports that are active.
If you uncheck the Active Only box, all inactive custom reports will be included in the Custom Reports list.
Options to Refine Reports
Display Options
Depending on the information, an option might be more suitable than another one to view that information. BEFORE changing the display, make any adjustments or modifications while in Horizontal Series.
Horizontal Series
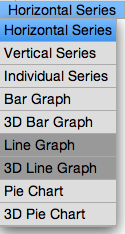
• By default, you are on the 'Horizontal Series', which displays students on the left, in rows, and data in columns. It is recommended you make all adjustments needed prior to selecting a different display option.
• The dark grey shaded options in the drop-down when clicking on Horizontal Series indicate that they are not available, based on the selection.
Vertical Series
• The Vertical Series displays the information in rows and the students in columns.
Individual Series
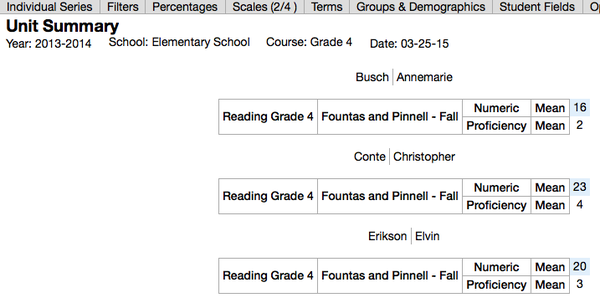
• The Individual Series displays the information grouped by student.
Bar Graph and 3D Bar Graph
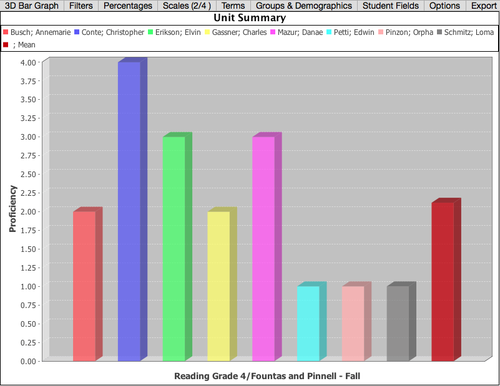
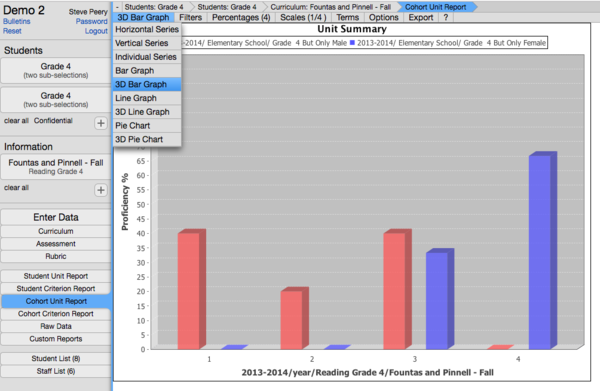
- Depending on the report you create, this type of graph can be used to display the information for individual students or student cohorts.
- At the top of the graph, you'll find the key to each color.
- If you wish to make changes to the settings for the report, select Horizontal Series to go back to the initial display and make the changes.
Pie Chart and 3D Pie Chart
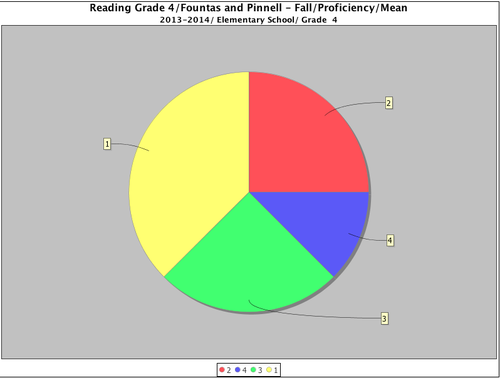
- The ability to create pie charts in VCAT is very basic and colors are not consistent. It is strongly recommended you export the data from your report to excel and use excel to build your pie charts with custom colors and settings.
Filters
• Click on the green '+' button to add a row that will give you options to filter the data.
• You have the option to 'Keep' or 'Hide' certain criteria based on their value/score in comparison to another value or item itself.
- You have the option to choose which criteria you want to focus on.
- You have the option to pick on the condition (equal, greater than, ...) to be met to isolate the students you want to focus on.
- You have the option to select a Number to focus on specific scores/values or an Item to compare two different criteria.
- The filter allows you to keep (or hide) students that may be just within a certain score range (example + or - 3 pts of a certain score).
- The filter is helpful to isolate students you want to look at. In the example below, the filter will keep students that had their proficiency dropped in their Winter assessment compared to their Fall assessment.
Percentages
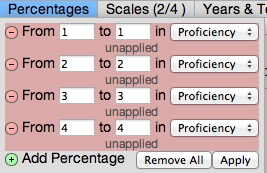
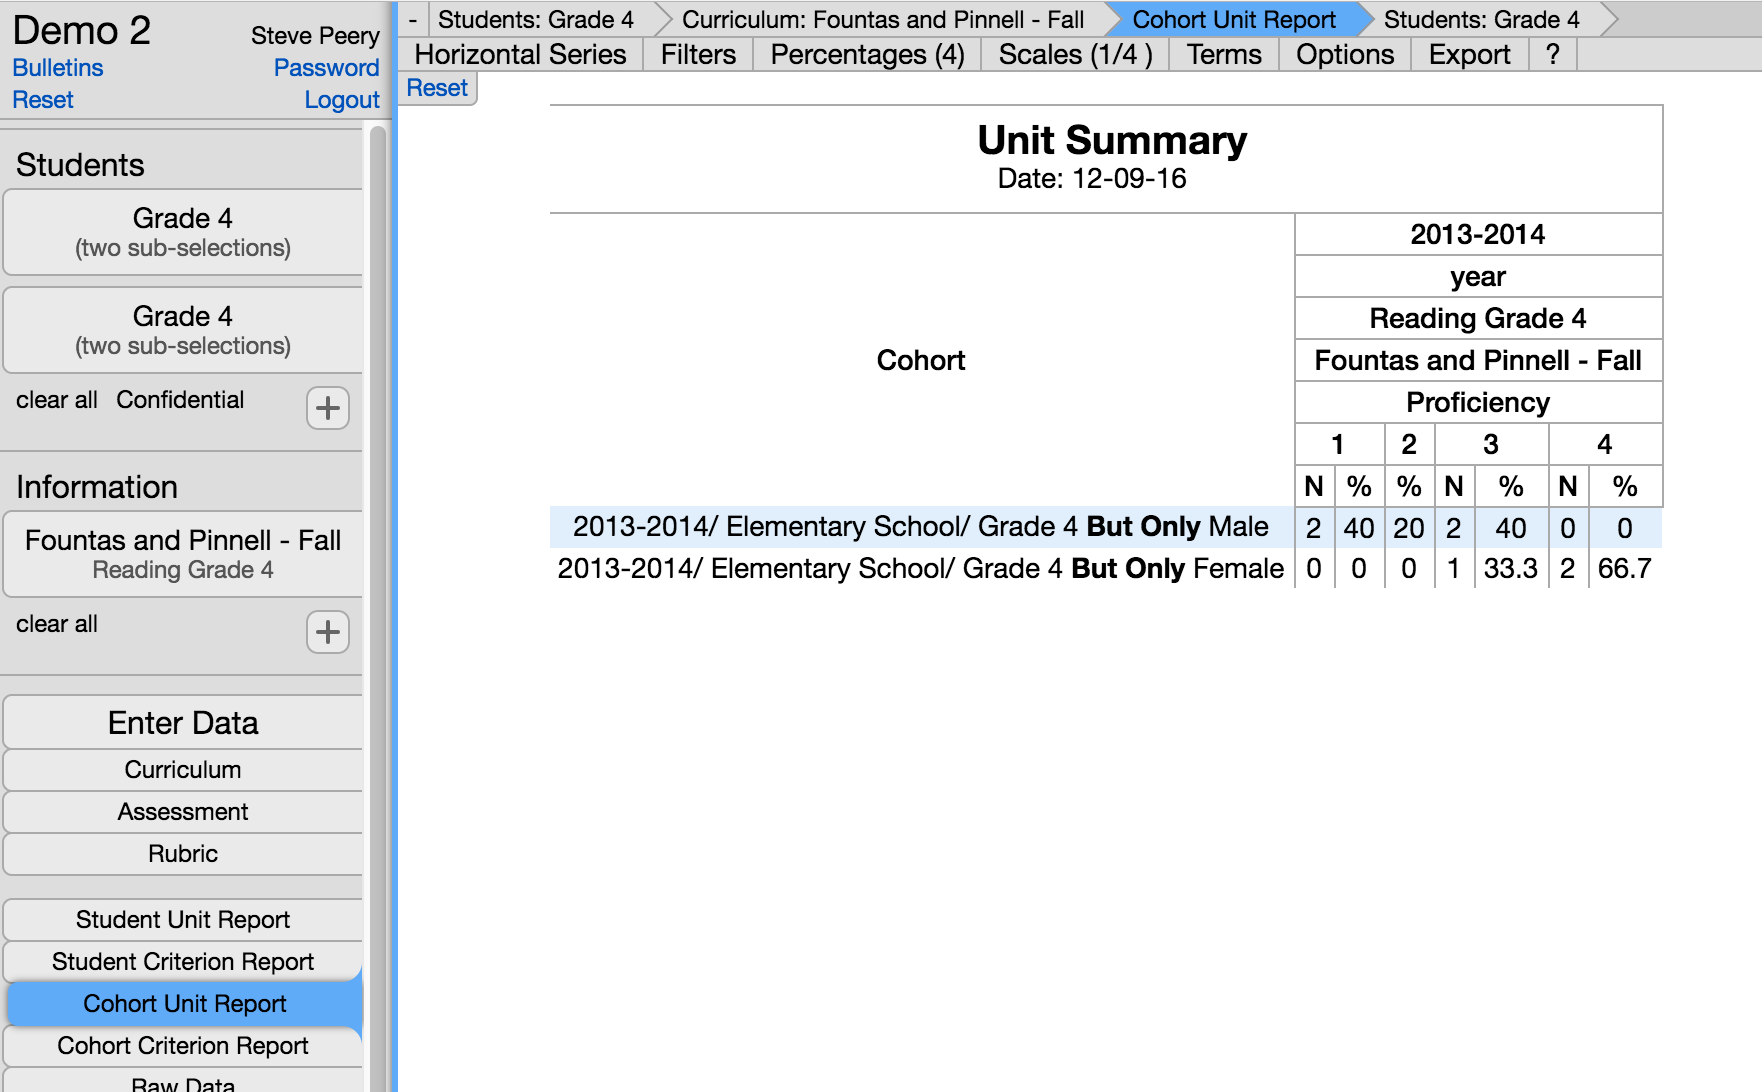
- It can be helpful to look at the data from the report using Percentages. The example below is using Percentages to get the percentage of student cohorts for each proficiency level (1-4).
- Click on Percentages at the top.
Scales
Terms
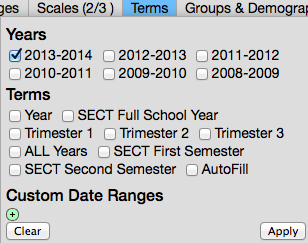
This feature can be used to limit the data you are looking at. For example, if a student has two pieces of data due to taking the assessment this year and the previous year, checking the current year under Terms would isolate his data and only the data coming from this year would be displayed. The student's last year's data would be ignored.
Sample of student with 2 years of data. By default, the system averages the student's scores:
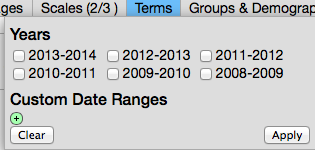
To limit the displayed data to the current year (or a specific year), go to Terms, in the option bar at the top, select the Year, and click on Apply:
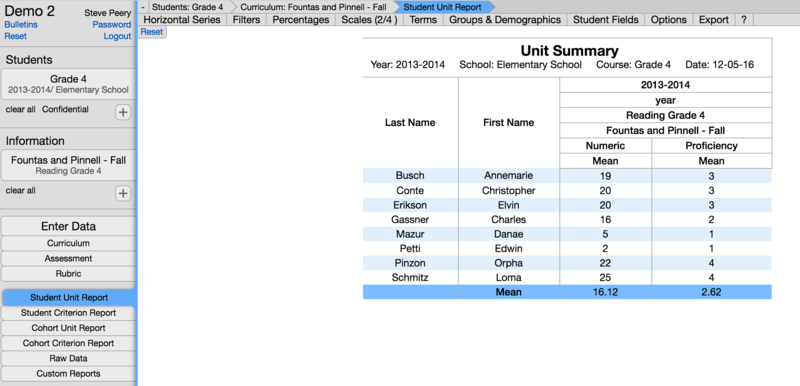
The data is then displayed for the year selected only:
Notice that because there is only one piece of data for each student, the N values aren't showing. The default setting is for the N values to only show if there is more than 1. In this case, because one student had more than one piece of data (coming from 2 separate years), the N column appeared on the report.
Note that, in this case, the curriculum rubric was using 'Year' as the term. If yours is using trimesters, for example, you may also want to check the Trimerster 1, 2, and 3 boxes before clicking Apply.
Groups & Demographics
This feature is used to add student group information or demographic information to the student reports, if demographics information is kept in VCAT.
This feature will not give you a 'mean' for a particular group, like Male vs Female for example. In order to get that information, you would need to select the students using a composite cohort with the gender.
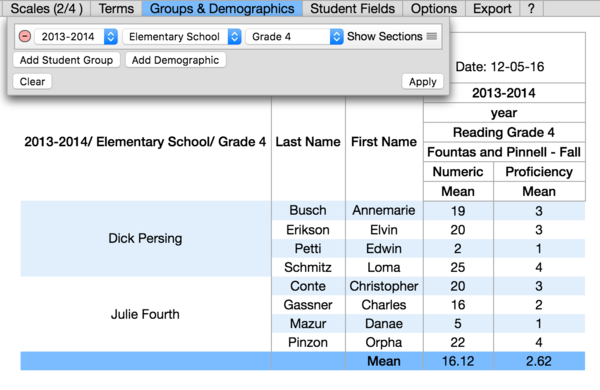
In the example below, the students were selected at the Grade level (all 4th graders):
Add Student Group
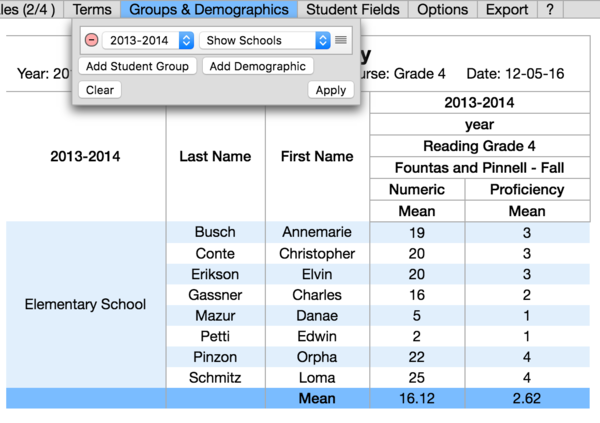
Selecting the Year only, will allow the School name to show on the student report. Make your selection and click on Apply to see the student group on the student report. In this example, Elementary School is the actual name of the school.
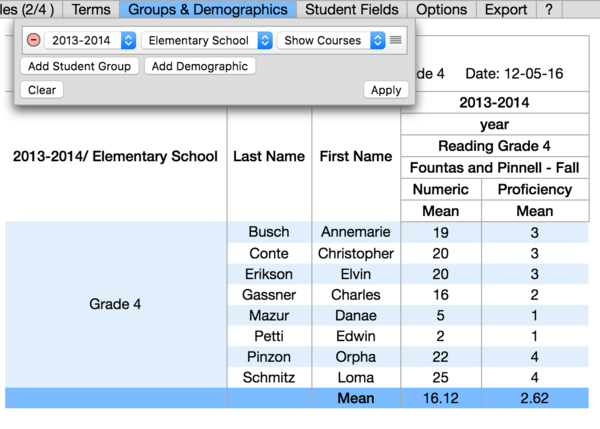
Selecting the Year, and the School, will allow the Course name to be displayed on the student report. Make your selection and click on Apply to see the student group on the student report. In this example, Grade 4 is the actual course name of the group selected.
Selecting the Year, and the School, and the Course will allow the Section names to be displayed on the student report. Make your selection and click on Apply to see the student group on the student report. In this example, Dick Persing and Julie Fourth are the section names. In the Grade 4 course selected, these are the two sections.
Add Demographic
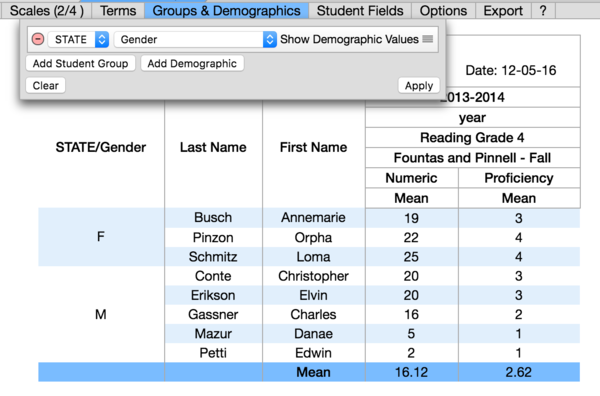
To add a demographic - like Male and Female - to the students selected, click on Groups & Demographics. In this demo, the demographic set is called 'STATE' but, in reality, it would most likely be found under a demographic set called 'Permanent' for Gender and Race, or under a year specific demographic set (Current, 2015-2016, 2014-2015,...) for demographics like IEP, 504, SES,... In this example, I picked the demographic set (STATE), then the demographic name within that set (Gender), and F and M (the demographic values in this case) are displayed on the student report after I clicked on Apply:
As mentioned at the very beginning of this Groups & Demographics section, this feature will not give you a 'mean' for a particular group, like Male vs Female for example. In order to get that information, you would need to select the students using a composite cohort with the gender.
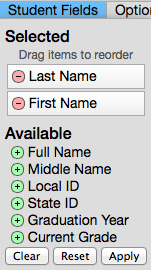
Student Fields
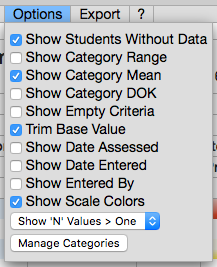
Options
Show Students Without Data
When running a student criterion report, you have the options to hide students without data. By default, Students Without Data is checked. To hide the students without data, just remove that check and it will update the report.
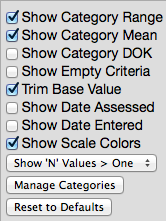
Show Category Range
• This option allows you to display on the report the range of the scores for each criterion.
Show Category Mean
• This option is checked by default. It shows the mean (average) score for each criterion.
Show Empty Criteria
• If there is no data for the information selected, the report will show those criteria anyway but, if part of the information selected has data and part of it doesn't, the criteria that do not have data will be hidden by default. In order to make them visible, 'Show Empty Criteria' has to be checked.
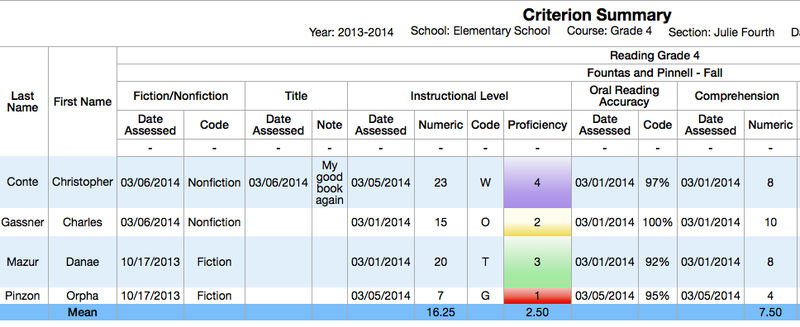
Show Date Assessed
• This option displays the Date Assessed on record for each data point.
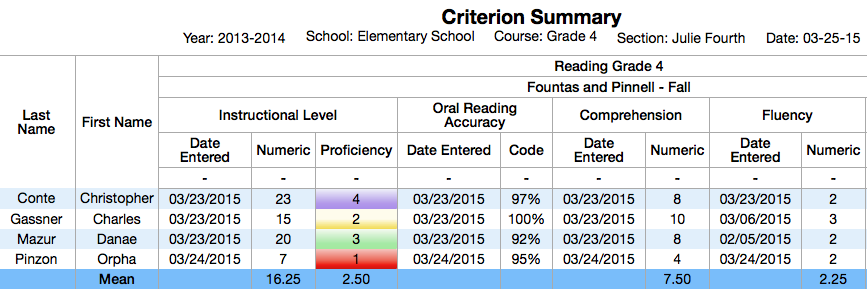
Show Date Entered
• This option displays the date when each data point was actually entered.
Combine Versions
• This option is checked by default and combines versions. When unchecked, it will display the detail of the version in which it found data in the header. See the example below with NECAP data.
Show Scale Color
• This option is checked by default. It displays the colors associated with the proficiency scale if the criterion has defined proficiency levels for its values (scores/ratings).
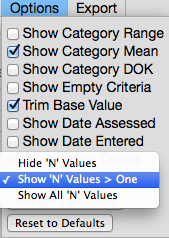
Show 'N' Values
• By default, only 'N' values greater than 1 will be displayed. You also have the option to hide or show all 'n' values.
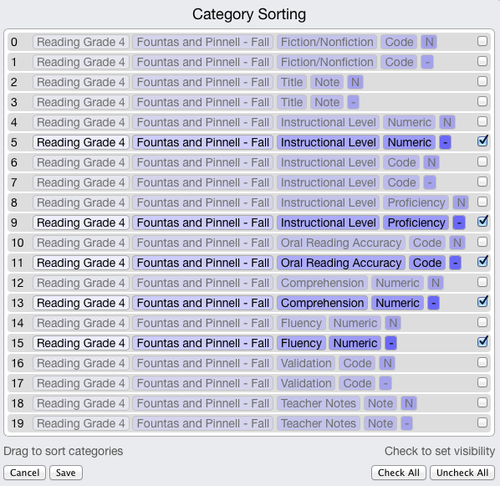
Manage Categories
• This option gives you the ability to quickly manually select criteria by checking or unchecking individual ones or all at once with 'Check All' or 'Uncheck All'. It includes a drag and order feature to let you sort the criteria as well. To do so, just click on the criterion and drag to where you want it.
Reset to Default
• Reset to Default will show up under Options when custom settings are used. This option gives you the ability to remove at once all changes you have made using the filter bar. It will remove those settings and reset the report to its initial state.
Export
Options to Export Reports
Export to PDF
This feature will export the report into a pdf format. Beware that if there is too much information on the report (what you currently have displayed on the screen), the information might not lay out correctly and may be illegible.
Export to Excel
This feature allows you to export to excel (spreadsheet format) to give you the ability to manipulate the data file if needed.
Export to PNG
Graphic reports and charts are simply pictures on a webpage. To export, right-click (control-click on Mac) on the picture and save the image to your disc. You can also copy and paste the image directly to a document editor like Microsoft Word.
