Difference between revisions of "Selecting Students"
(→Individual Students) |
|||
| (28 intermediate revisions by one user not shown) | |||
| Line 8: | Line 8: | ||
[[File:VCAT2_StudentsSelected.png]] | [[File:VCAT2_StudentsSelected.png]] | ||
| + | |||
=== Individual Students === | === Individual Students === | ||
| + | |||
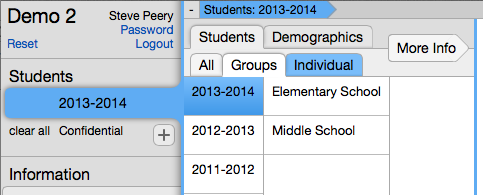
1. By default, you are under Groups tab where you can select the Year, School, Course, and Section. Click on Individual tab, to the right of the Groups tab. | 1. By default, you are under Groups tab where you can select the Year, School, Course, and Section. Click on Individual tab, to the right of the Groups tab. | ||
| − | [[File: | + | [[File:Wiki_VCAT2_IndividualTab.png]] |
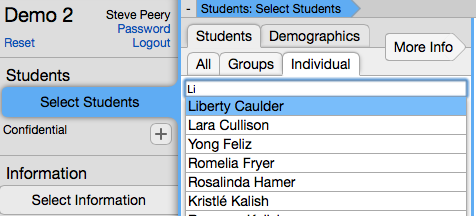
| − | 2. Type first name OR last name (or part of either one) in the Search field. | + | 2. Type first name OR last name (or part of either one) in the Search field. Click on the student name from the list displayed to select that student. |
| − | [[File: | + | [[File:Wiki_VCAT2_IndividualTab_typePartName_selectIndiv.png]] |
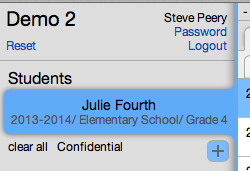
| − | 3 | + | 3. Now, the student's name shows up in the Students box and also on the right, with a little minus sign in a red circle. If you wish to remove that student, click on the red circle. |
[[File:VCAT2_1IndivStud.png]] | [[File:VCAT2_1IndivStud.png]] | ||
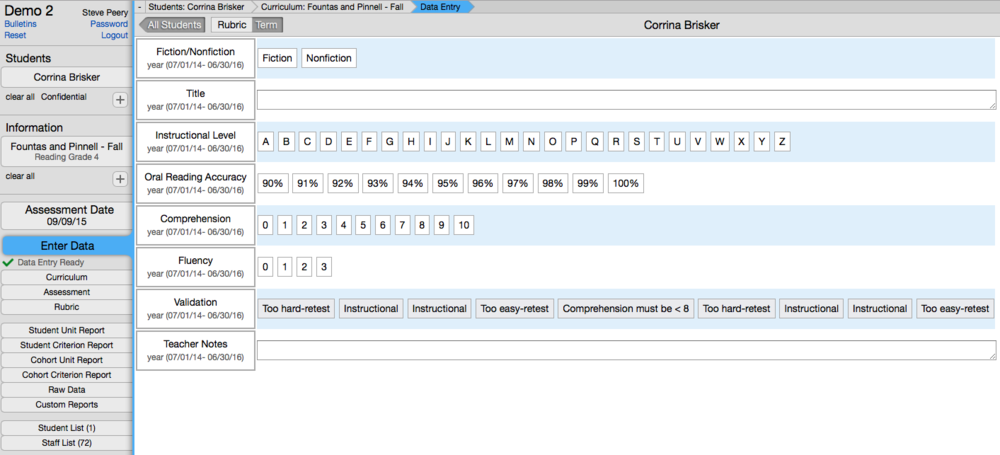
| + | '''When an individual student is selected, data entry is automatically in Rubric mode, as opposed to the usual All Students mode.''' | ||
| − | 4. Repeat | + | [[File:Wiki2_IndivStudSelected_DataEntry_RubricMode.png|1000px]] |
| + | |||
| + | |||
| + | 4. Repeat step 2 for each individual student you want to add. | ||
The individual students selected show in one student box therefore, they are considered as one cohort. | The individual students selected show in one student box therefore, they are considered as one cohort. | ||
| − | [[File: | + | [[File:Wiki_VCAT2_IndividualTab_typePartName_selectIndiv+_cohort.png]] |
= Multiple Cohorts = | = Multiple Cohorts = | ||
| Line 35: | Line 41: | ||
Multiple cohorts or groups of students can be selected so each group is separate and can be compared with each other. | Multiple cohorts or groups of students can be selected so each group is separate and can be compared with each other. | ||
| − | 1. [[#One Whole Group of Students| | + | 1. Select a [[#One Whole Group of Students|single cohort]] or [[#Composite Cohorts|composite cohort]]. |
2. Click on the + under the Students Box to add another group. By default, it will create an exact copy of the group you have selected. Adjust that selection by clicking on a different section if you want to keep the same Year, School, and Course (Grade), or select the correct Year, School, Course, and Section that represent the group you are interested in. | 2. Click on the + under the Students Box to add another group. By default, it will create an exact copy of the group you have selected. Adjust that selection by clicking on a different section if you want to keep the same Year, School, and Course (Grade), or select the correct Year, School, Course, and Section that represent the group you are interested in. | ||
| Line 48: | Line 54: | ||
3. Repeat step 2 for each group you wish to add. | 3. Repeat step 2 for each group you wish to add. | ||
| + | |||
= Composite Cohorts = | = Composite Cohorts = | ||
VCAT offers you the flexibility of grouping students in a variety of ways. The versatility of the 'More Info' button allows you to make a student compound selection using PLUS, MINUS, BUT ONLY attributes. Students can be grouped in multitude of combinations: across years, schools, grades, and based on specific demographics, to form one group/cohort. | VCAT offers you the flexibility of grouping students in a variety of ways. The versatility of the 'More Info' button allows you to make a student compound selection using PLUS, MINUS, BUT ONLY attributes. Students can be grouped in multitude of combinations: across years, schools, grades, and based on specific demographics, to form one group/cohort. | ||
| − | |||
Here are some examples. | Here are some examples. | ||
| Line 60: | Line 66: | ||
Here's how to select the same section (same teacher), over multiple years, to create one cohort: | Here's how to select the same section (same teacher), over multiple years, to create one cohort: | ||
| − | 1. [[# | + | 1. [[#Single Cohort|Select the Students]]. |
2. Click on the 'More Info' button/arrow above the section column. | 2. Click on the 'More Info' button/arrow above the section column. | ||
| − | [[File: | + | [[File:Wiki_VCAT2_SelectStudents_JF_MoreInfo.png]] |
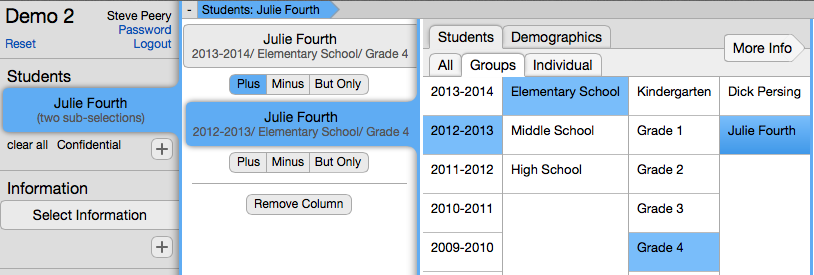
3. Click on 'Plus' to have the option of adding a group of students. Select the Year, School, Course, and Section. In this example, the same section from a previous year will be added. | 3. Click on 'Plus' to have the option of adding a group of students. Select the Year, School, Course, and Section. In this example, the same section from a previous year will be added. | ||
| − | [[File: | + | [[File:Wiki_VCAT2_SelectStudents_JF_MoreInfo_Plus_PreviousYear.png]] |
| − | + | ||
| − | + | ||
| − | + | ||
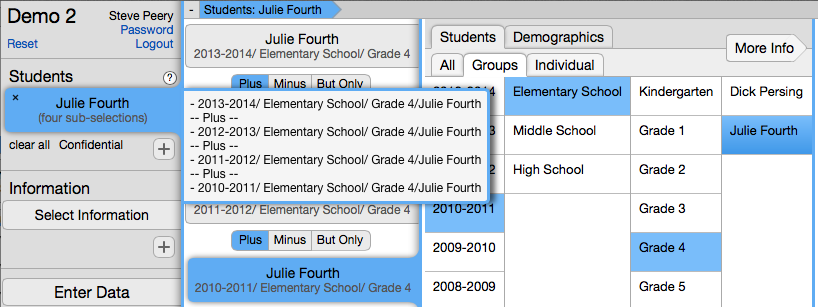
4. Repeat step 3 to keep adding to the same cohort. When you hover over the Students Box, it will give you the detail of your cohort. | 4. Repeat step 3 to keep adding to the same cohort. When you hover over the Students Box, it will give you the detail of your cohort. | ||
| − | [[File: | + | [[File:Wiki_VCAT2_4subSelections.png]] |
| − | + | ||
=== Across Schools === | === Across Schools === | ||
| − | Basically, similar steps as above but, instead of changing the Year for each selection, you keep the Year and Course identical as your initial selection and you just pick a different School. | + | Basically, similar steps as above but, instead of changing the Year for each selection, you keep the Year and Course identical as your initial selection and you just pick a different School and Section. |
| − | 1. [[# | + | 1. [[#Single Cohort|Select the Students]]. (Year, School, Course) |
2. Click on the 'More Info' button/arrow above the section column. | 2. Click on the 'More Info' button/arrow above the section column. | ||
| Line 95: | Line 97: | ||
=== Using Demographics === | === Using Demographics === | ||
| − | Often, there is a need to view data not only for a group of students in its entirety but also for certain sub groups (IEP students, SES students,…) within that group. | + | Often, there is a need to view data not only for a group of students in its entirety but also for certain sub groups (Male, Female, IEP students, SES students,…) within that group. NECAP demographics are imported in VCAT when the NECAP data is imported but do not necessarily match the current demographics. It is up to each district/SU to keep track and update their current [[Demographics|demographics]] if they wish to have a more accurate analysis. |
| + | |||
| + | If you do not have your own district/SU demographics in VCAT, and have the categories like Male, Female, IEP, and SES, they will only be related to the old NECAP demographics imported with the NECAP data. | ||
| + | |||
| + | '''Go to''' [[Demographics|Demographics]] '''to learn more on how any demographic can be included and maintained in VCAT for your SU/District.''' | ||
| + | |||
| + | |||
| + | Here's an example where a group of students gets broken down by Male and Female. Except with the Gender specific selection, the same steps could be followed for other demographics as well. | ||
| + | |||
| + | ==== Gender ==== | ||
| + | |||
| + | 1. [[#Single Cohort|Select the Students]]. | ||
| + | |||
| + | |||
| + | 2. Click on the 'More Info' button/arrow above the section column. | ||
| + | |||
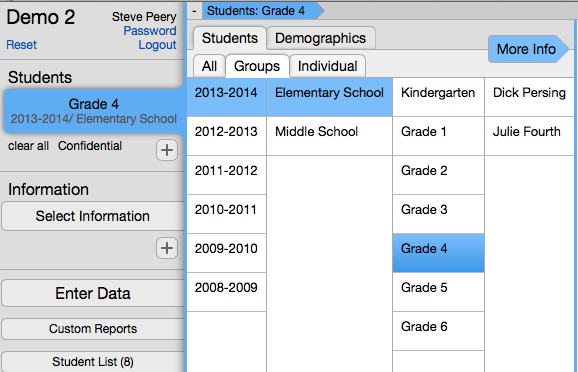
| + | [[File:VCAT2_Gr4_MoreInfoHighlighted_and_studentList.png]] | ||
| + | |||
| + | Notice that this entire group of students has a total of 8 students (Student List). | ||
| + | |||
| + | |||
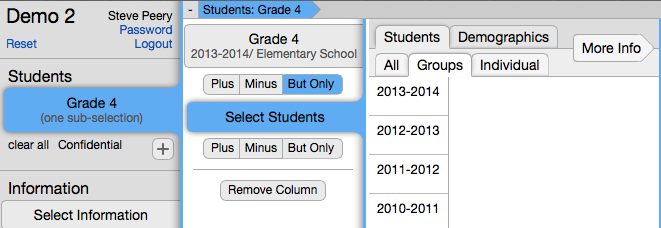
| + | 3. Click on 'But Only'. | ||
| + | |||
| + | [[File:VCAT2_Gr4_MoreInfo_ButOnly.png]] | ||
| + | |||
| + | |||
| + | 4. Click on 'Demographics' tab. | ||
| + | |||
| + | [[File:VCAT2_Gr4_ButOnly_Demographics.png]] | ||
| + | |||
| + | |||
| + | 5. Select the 'Male' Category. | ||
| + | |||
| + | [[File:VCAT2_Gr4_ButOnly_Demographics_Male_w_studentList.png]] | ||
| + | |||
| + | Notice that the Student List now displays 5 - out of the 8 we started with, 5 of them are Male. | ||
| + | |||
| + | |||
| + | [[File:VCAT2_StudInfo_StudList8_moreInfo_ButOnly_Male_hover.png]] | ||
| + | |||
| + | Again, if you hover over the Students Box, you will get the detail of your students selection. | ||
| + | |||
| + | |||
| + | 6. Click on the '+' under the Students box. It will add a cohort that is an exact copy of the one right above it that was just created. | ||
| + | |||
| + | [[File:VCAT2_ButOnlyMaleCopy.png]] | ||
| + | |||
| + | |||
| + | 7. Now click on the 'Male Demographic' box. It will bring up the next column with the demographic categories. Click on Female. | ||
| + | |||
| + | [[File:VCAT2_ButOnlyFemale.png]] | ||
| + | |||
| + | |||
| + | 8. [[Selecting Information|Select the information]] you want to view by clicking on Select Information box, in that very first column on the left. | ||
| + | |||
| + | |||
| + | 9. Select a student report. See different samples below. | ||
| + | |||
| + | '''Student Unit Report''' | ||
| + | |||
| + | [[File:Wiki_StudentUnitReport_CompositeCohort_w_GendeDemographics.png|700px]] | ||
| + | |||
| + | Notice that you now have 2 cohorts: Grade 4 Male students and Grade 4 Female students. If you wanted, you could also add the Grade 4 students as a cohort (you would have 3 cohorts) so you could look at their data as a whole group, and compare it with the males and females from that group. | ||
| + | |||
| + | |||
| + | '''Cohort Unit Report''' | ||
| + | |||
| + | [[File:Wiki_CohortUnitReport_CompositeCohort_w_GendeDemographics.png|700px]] | ||
| + | |||
| + | |||
| + | '''From this last sample''', here are the next steps if you would be interested to look at the percentages for each proficiency level (1-4) for Male and Female: | ||
| + | |||
| + | * Click on Scales, in the menu bar at the top, uncheck all scales except Proficiency, and hit Apply. | ||
| + | * Click on Percentages, in the menu bar at the top, and add a row for each proficiency by clicking the + Add Percentage. Set them up with From 1 to 1, From 2 to 2, From 3 to 3, and From 4 to 4 in Proficiency and hit Apply. | ||
| + | [[File:Wiki_Percentages.png|200px]] | ||
| + | |||
| + | * Click on Horizontal Series, in the menu bar at the top left, and select 3D Bar Graph. | ||
| + | |||
| + | [[File:Wiki_CohortUnitReport_CompositeCohort_w_GendeDemographics_Percentages_3D_BarGraph.png|700px]] | ||
Latest revision as of 16:45, 9 February 2018
Contents
Single Cohort
You can select students by group or individually.
One Whole Group of Students
Based on your access, a group of students may already be selected by default and highlighted in blue. If not, you need to select (by clicking on it) the Year, the School, the Course, and the Section you want to enter data for. If your access allows it, you may be able to enter data at the Course level. The detail for the group of students you selected will show in the Students box.
Individual Students
1. By default, you are under Groups tab where you can select the Year, School, Course, and Section. Click on Individual tab, to the right of the Groups tab.
2. Type first name OR last name (or part of either one) in the Search field. Click on the student name from the list displayed to select that student.
3. Now, the student's name shows up in the Students box and also on the right, with a little minus sign in a red circle. If you wish to remove that student, click on the red circle.
When an individual student is selected, data entry is automatically in Rubric mode, as opposed to the usual All Students mode.
4. Repeat step 2 for each individual student you want to add.
The individual students selected show in one student box therefore, they are considered as one cohort.
Multiple Cohorts
Multiple cohorts or groups of students can be selected so each group is separate and can be compared with each other.
1. Select a single cohort or composite cohort.
2. Click on the + under the Students Box to add another group. By default, it will create an exact copy of the group you have selected. Adjust that selection by clicking on a different section if you want to keep the same Year, School, and Course (Grade), or select the correct Year, School, Course, and Section that represent the group you are interested in.
Each group shows up in its own student box and therefore, each group is considered a separate cohort.
3. Repeat step 2 for each group you wish to add.
Composite Cohorts
VCAT offers you the flexibility of grouping students in a variety of ways. The versatility of the 'More Info' button allows you to make a student compound selection using PLUS, MINUS, BUT ONLY attributes. Students can be grouped in multitude of combinations: across years, schools, grades, and based on specific demographics, to form one group/cohort.
Here are some examples.
Across Years
Here's how to select the same section (same teacher), over multiple years, to create one cohort:
2. Click on the 'More Info' button/arrow above the section column.
3. Click on 'Plus' to have the option of adding a group of students. Select the Year, School, Course, and Section. In this example, the same section from a previous year will be added.
4. Repeat step 3 to keep adding to the same cohort. When you hover over the Students Box, it will give you the detail of your cohort.
Across Schools
Basically, similar steps as above but, instead of changing the Year for each selection, you keep the Year and Course identical as your initial selection and you just pick a different School and Section.
1. Select the Students. (Year, School, Course)
2. Click on the 'More Info' button/arrow above the section column.
3. Click on 'Plus' to have the option of adding a group of students. Select the Year (same as previous), School (different one), Course (same as previous). In this example, the same Course from a different School will be added.
Using Demographics
Often, there is a need to view data not only for a group of students in its entirety but also for certain sub groups (Male, Female, IEP students, SES students,…) within that group. NECAP demographics are imported in VCAT when the NECAP data is imported but do not necessarily match the current demographics. It is up to each district/SU to keep track and update their current demographics if they wish to have a more accurate analysis.
If you do not have your own district/SU demographics in VCAT, and have the categories like Male, Female, IEP, and SES, they will only be related to the old NECAP demographics imported with the NECAP data.
Go to Demographics to learn more on how any demographic can be included and maintained in VCAT for your SU/District.
Here's an example where a group of students gets broken down by Male and Female. Except with the Gender specific selection, the same steps could be followed for other demographics as well.
Gender
2. Click on the 'More Info' button/arrow above the section column.
Notice that this entire group of students has a total of 8 students (Student List).
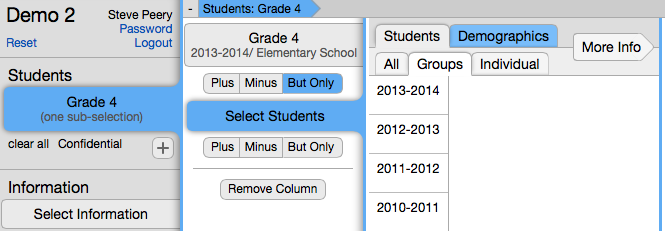
3. Click on 'But Only'.
4. Click on 'Demographics' tab.
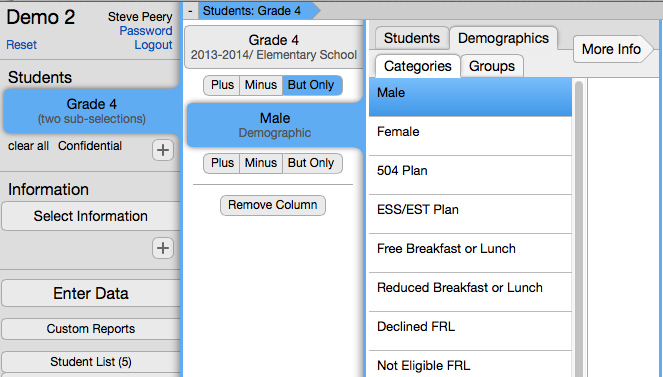
5. Select the 'Male' Category.
Notice that the Student List now displays 5 - out of the 8 we started with, 5 of them are Male.
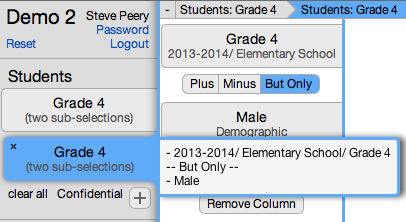
Again, if you hover over the Students Box, you will get the detail of your students selection.
6. Click on the '+' under the Students box. It will add a cohort that is an exact copy of the one right above it that was just created.
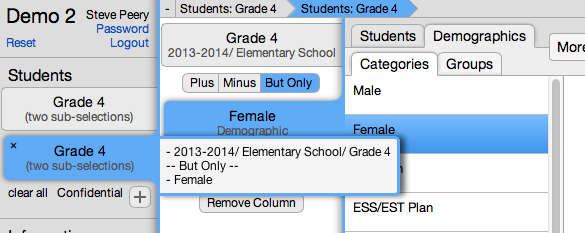
7. Now click on the 'Male Demographic' box. It will bring up the next column with the demographic categories. Click on Female.
8. Select the information you want to view by clicking on Select Information box, in that very first column on the left.
9. Select a student report. See different samples below.
Student Unit Report
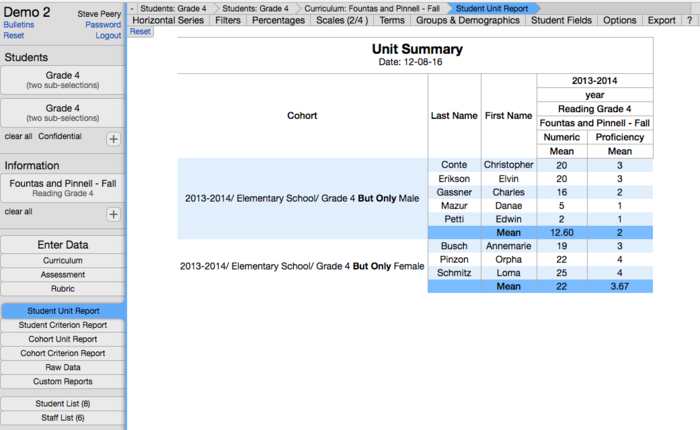
Notice that you now have 2 cohorts: Grade 4 Male students and Grade 4 Female students. If you wanted, you could also add the Grade 4 students as a cohort (you would have 3 cohorts) so you could look at their data as a whole group, and compare it with the males and females from that group.
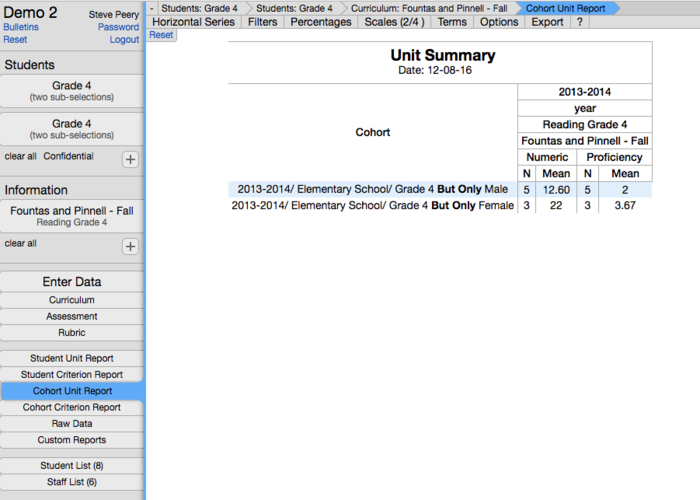
Cohort Unit Report
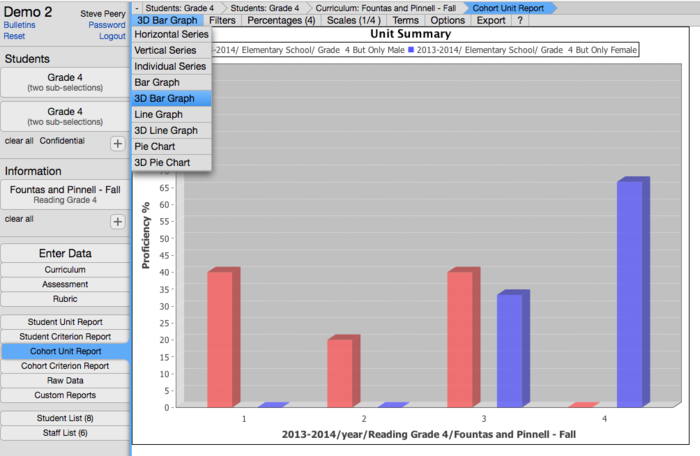
From this last sample, here are the next steps if you would be interested to look at the percentages for each proficiency level (1-4) for Male and Female:
- Click on Scales, in the menu bar at the top, uncheck all scales except Proficiency, and hit Apply.
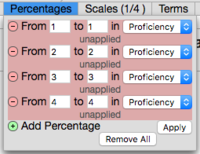
- Click on Percentages, in the menu bar at the top, and add a row for each proficiency by clicking the + Add Percentage. Set them up with From 1 to 1, From 2 to 2, From 3 to 3, and From 4 to 4 in Proficiency and hit Apply.
- Click on Horizontal Series, in the menu bar at the top left, and select 3D Bar Graph.

