Viewing Data
Options to View Data
There are many options to view data in VCAT. Data can be viewed not only where you enter the data but, also using the following reports:
• Student Unit Report
• Student Criterion Report
• Cohort Unit Report
• Cohort Criterion Report
• Custom Reports
Student Unit Report
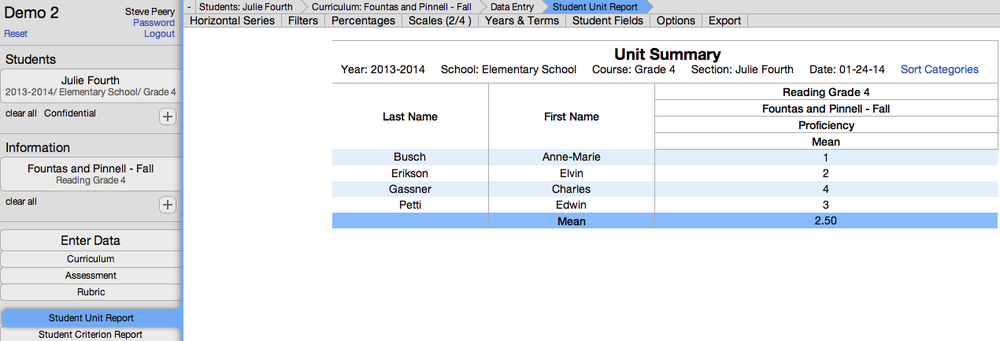
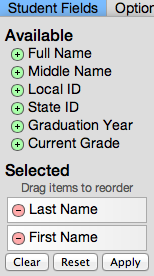
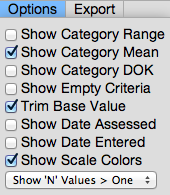
In this sample, one group of students is selected with one piece of information. Students are listed in alphabetical order using their last name. This Student Unit Report displays one student per row with one summarized value for the unit. The summarized value is dependent on the weight assigned to the criteria in the unit. If one criterion has all of the weight (100%), then that score will be used as the summary value to give a quick snapshot for that unit. If more criteria share the weight equally distributed (by default), the summarized value will be an average of the weighted criteria. Occasionally, none of the criteria are weighted. When that is the case, no summarized value can be calculated therefore, the Student Unit Report can't be generated. The bottom row highlighted in blue gives you the Mean (average) scores for the group of students you have selected. Many options are available to refine this report.
Student Criterion Report
In this sample, one group of students is selected with one piece of information. Students are listed in alphabetical order using their last name. This Student Unit Report displays one student per row with the detailed scores for each of the criteria in the unit in individual columns. The bottom row highlighted in blue gives you the Mean (average) scores for the group of students you have selected. Many options are available to refine this report.
Cohort Unit Report
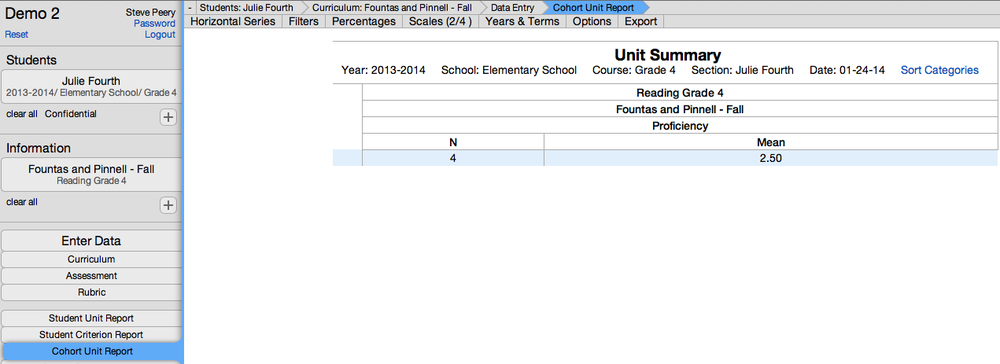
In this sample, one group of students is selected with one piece of information. This report displays one cohort per row with the mean of the summarized values for the cohort. The 'N' of 4 indicates that there are 4 students with data included in the Mean. Many options are available to refine this report.
Cohort Criterion Report
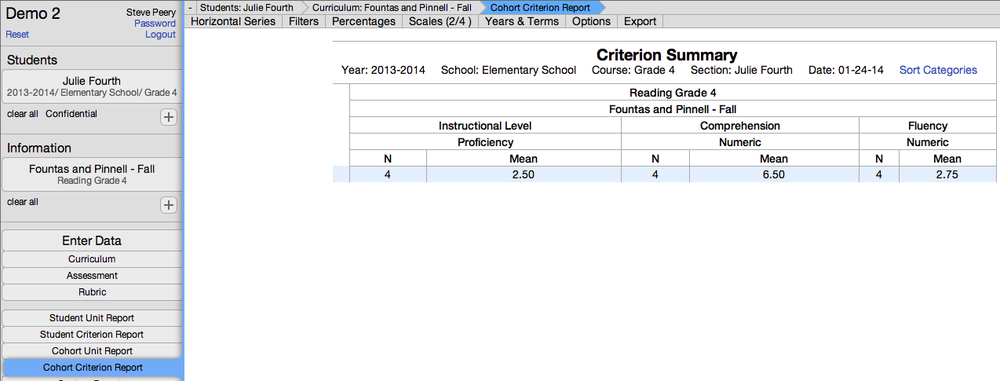
In this sample, one group of students (cohort) is selected with one piece of information. This report displays one cohort per row with the mean score for each of the criteria with numeric scores in the unit. The 'N' indicates the number of students with data included in each of the criterion mean. Many options are available to refine this report.
Custom Reports
Custom Reports are reports specifically created and customized for your SU/district, and ready to download/print. Report Cards, Progress Reports, Placement Forms, and Student Accommodation Plan would be some examples of custom reports.
1. Select the student(s).
2. Click on Custom Reports to get the list of custom reports available to you.
3. Select the date. The date displayed on the left of the filter bar is the date you wish to run the report for. If the date needs to be changed, simply click on it and you will be prompted to choose a date with a calendar. Select a new date and click on Ok.
4. Select the custom report of your choice by clicking on PDF. The list can be filtered by Type, Grade, and/or Subject to narrow down the selection. Use the Clear button to the right of the Subject filter to cancel all filters.
Options to Refine Report
Display Options
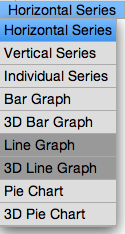
• By default, you are on the 'Horizontal Series', which displays students on the left and data in columns on the right. It is recommended you make all adjustments needed prior to selecting a different display option.
• The dark grey shaded options indicate that they are not available, based on the selection.
Filters
• Click on the green '+' button to add a row that will give you options to filter the data.
• You have the option to 'Keep' or 'Hide' certain criteria based on their value/score in comparison to another value or item itself.
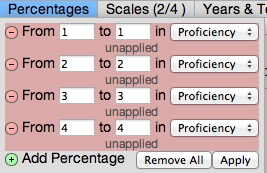
Percentages
